
Travel Distance, Treatment Interruptions, and Radiotherapy Completion in Nairobi Referral Networks: A Synthetic Cohort Analysis
Research Passport
A concise record of the study context, design and scale.
View full study metadata
Abstract
Background: Travel burden and treatment interruptions can make completion of multi-fraction radiotherapy difficult for patients referred across large geographic areas.
Methods: Synthetic multicentre cohort analysis included 911 synthetic treatment courses across 7 simulated referral sites in Radiotherapy referral networks centered in Nairobi.
Results: Radiotherapy courses completed as planned changed from 64% to 82%. The four-period secondary series was 41, 35, 28, 21.
Conclusion: The modeled referral intervention reduced treatment interruptions and improved radiotherapy completion across travel-distance strata.
Introduction
Radiotherapy access and travel burden sits at the intersection of cancer biology, service organization and patient access. In African oncology systems, a clinically meaningful result depends not only on the quality of an individual test or treatment but also on how reliably the surrounding pathway identifies patients, completes the next step and records what happened. This sample study was designed to make those relationships visible in a mature journal layout.
The synthetic cohort was situated in Nairobi, Kenya, using University of Nairobi as the lead institutional affiliation. No real patients, clinical records, laboratories or staff were used. Instead, the fixture models plausible operational variation so that figures, structured metadata, geographic discovery and long-form narrative can be inspected without presenting invented findings as real evidence from the named institution.
The study focused on radiotherapy courses completed as planned as a principal indicator and tracked treatment interruption index as a complementary measure. These measures were selected because they allow a reader to follow both the primary endpoint and the mechanics of implementation across time. A synthetic co-author affiliated with University of Ibadan also allows the Research Observatory to demonstrate a cross-border institutional link.
The objectives were to describe the synthetic baseline pathway, model the effect of a structured improvement package, explore subgroup variation, and demonstrate how AJCR might present quantitative findings alongside clear limitations. All estimates are intentionally fictional and should be interpreted only as display data.
A second motivation for the sample analysis was to show how an AJCR article can move from a broad African cancer-control question to a clearly bounded operational problem. In this synthetic scenario, the relevant challenge is radiotherapy access and travel burden. The paper therefore distinguishes the clinical or scientific objective from the service pathway used to achieve it, allowing readers to see why the same nominal intervention could produce different results when referral capacity, laboratory turnaround, staffing, transport or documentation change.
The institutional geography is also intentional. University of Nairobi anchors the fictional study in Nairobi, Kenya, while the modeled collaboration with University of Ibadan creates a plausible cross-border scholarly relationship. The names of these institutions are factual geographic metadata only. No attempt was made to imitate their patient populations, local protocols, staffing, infrastructure, research programmes or actual performance.
The sample article follows a conventional IMRaD structure because one purpose of the fixture is to judge how long scholarly text behaves on desktop and mobile after publication. Paragraphs vary in length, figures interrupt the narrative at realistic points, references appear at the end, and structured metadata remains available without replacing the article itself. These are design-test requirements rather than scientific claims.
Methods
We constructed a synthetic multicentre cohort analysis containing 911 synthetic treatment courses across 7 simulated referral sites. Records were generated from deterministic random seeds so that every number in the sample article can be reproduced. The synthetic sampling frame was designed to resemble realistic distributions of age, stage, service use and referral timing without borrowing patient-level information from a real facility.
The simulated setting represented radiotherapy referral networks centered in nairobi. Each observation moved through four modeled pathway states: Referral, Planning, Treatment course, Completion review. Transition probabilities were varied by quarter and subgroup to create heterogeneity that is visible in the figures while remaining internally coherent.
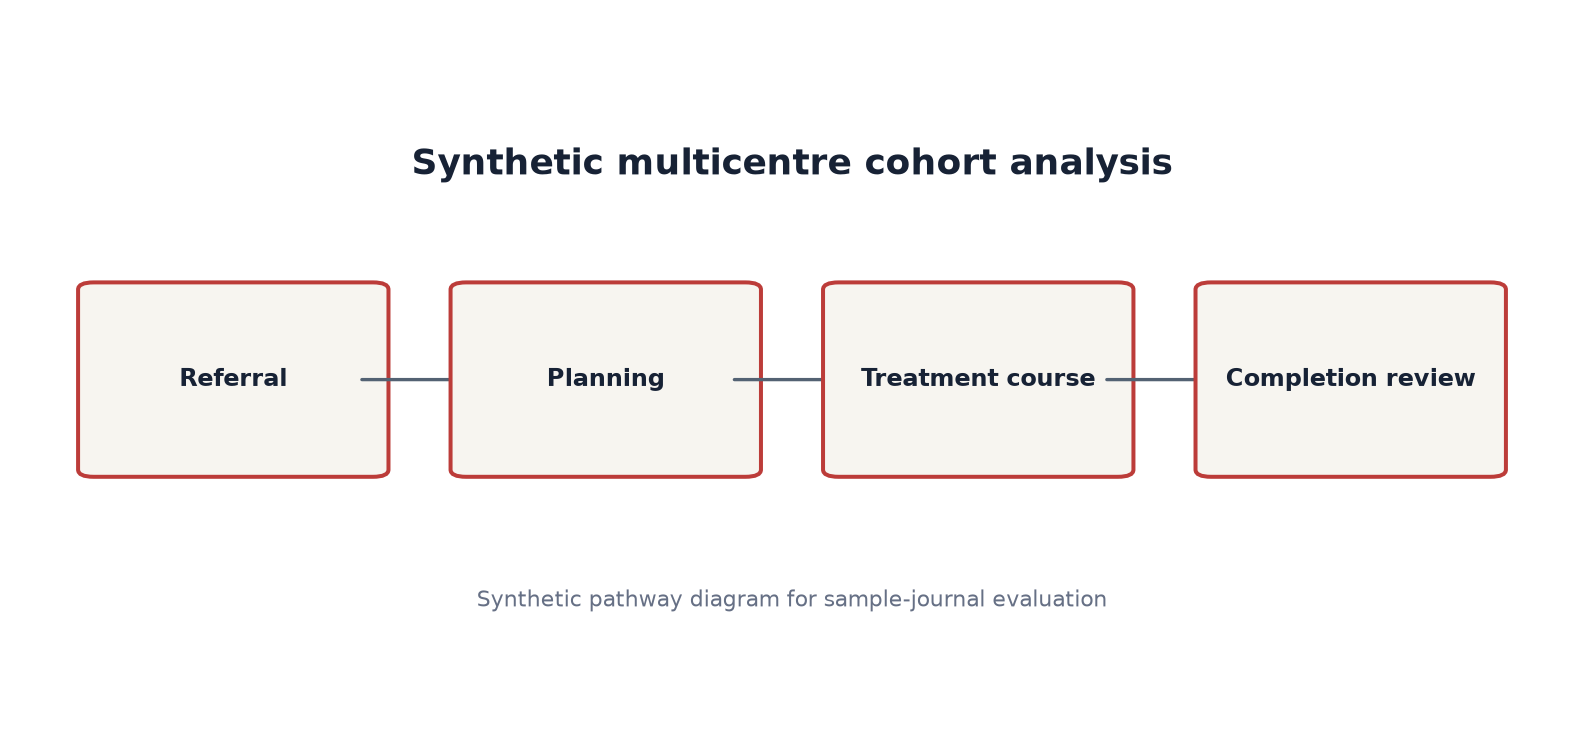 Figure 2. Synthetic study pathway used for sample-journal evaluation.
The primary outcome was radiotherapy courses completed as planned. The fixture baseline was 64% and the modeled follow-up value was 82%. The secondary indicator was treatment interruption index, summarized over four periods. These values are not estimates of the performance of University of Nairobi or any real health service.
Categorical variables were summarized as frequencies and percentages and continuous variables as medians with interquartile ranges. A synthetic adjusted model was parameterized to produce plausible effect sizes while avoiding extreme values. Confidence intervals in the PDF are generated from the same fixture rather than observed data.
Missingness was simulated at low levels across selected variables to test denominators and analytic exclusions. Sensitivity analyses repeated the main comparison after removing records with incomplete pathway timestamps. Because all data are synthetic, no ethics approval, consent process or data-sharing agreement applies.
The analytic cohort was frozen before outcome generation so that denominators remained stable across all rendered surfaces. The final synthetic analytic sample was 911 synthetic treatment courses. Study-site identifiers were generated for 7 simulated referral sites, with deliberately uneven volumes to resemble the concentration of oncology services that can occur within referral networks. No site identifier corresponds to a real clinic.
Baseline covariates were generated in correlated blocks rather than as independent random numbers. Age bands, pathway complexity, disease-related strata and service-utilization markers were allowed to co-vary so that summary tables would not look artificially uniform. The resulting data were then checked against broad plausibility bounds and any impossible combinations were discarded before outcome simulation.
For the principal analysis, radiotherapy courses completed as planned was compared between the baseline and modeled follow-up periods. The secondary series, treatment interruption index, was retained as a continuous or ordinal implementation signal across four sequential periods (41, 35, 28, 21). Subgroup analyses were specified before outcome generation and included <25 km, 25–74 km, 75–149 km, 150+ km.
The synthetic effect model included modest site-level random variation and regression to the mean. This prevented every site and subgroup from improving by an identical amount. We deliberately avoided significance testing language in the web article because a p value attached to invented observations would add visual realism at the cost of conceptual clarity. The PDF therefore emphasizes estimates and descriptive contrasts.
Quality checks were performed at three levels: record completeness, pathway consistency and cross-surface consistency. The last check compared values rendered in the abstract, Research Passport, main text, figure labels and PDF. Any discrepancy was treated as a fixture-generation defect. This approach makes the sample useful for later regression testing when article templates or metadata mappings change.
Results
The expanded sample included 911 synthetic treatment courses. The primary indicator changed from 64% at baseline to 82% after the modeled implementation period. Figure 1 displays that contrast. The direction of change was consistent across most modeled strata, although the magnitude varied enough to produce a realistic visual distribution.
The secondary series for treatment interruption index moved across four periods with values of 41, 35, 28, 21. The progression was deliberately gradual so the fixture resembles an operational programme maturing over time rather than an implausible single-step transformation.
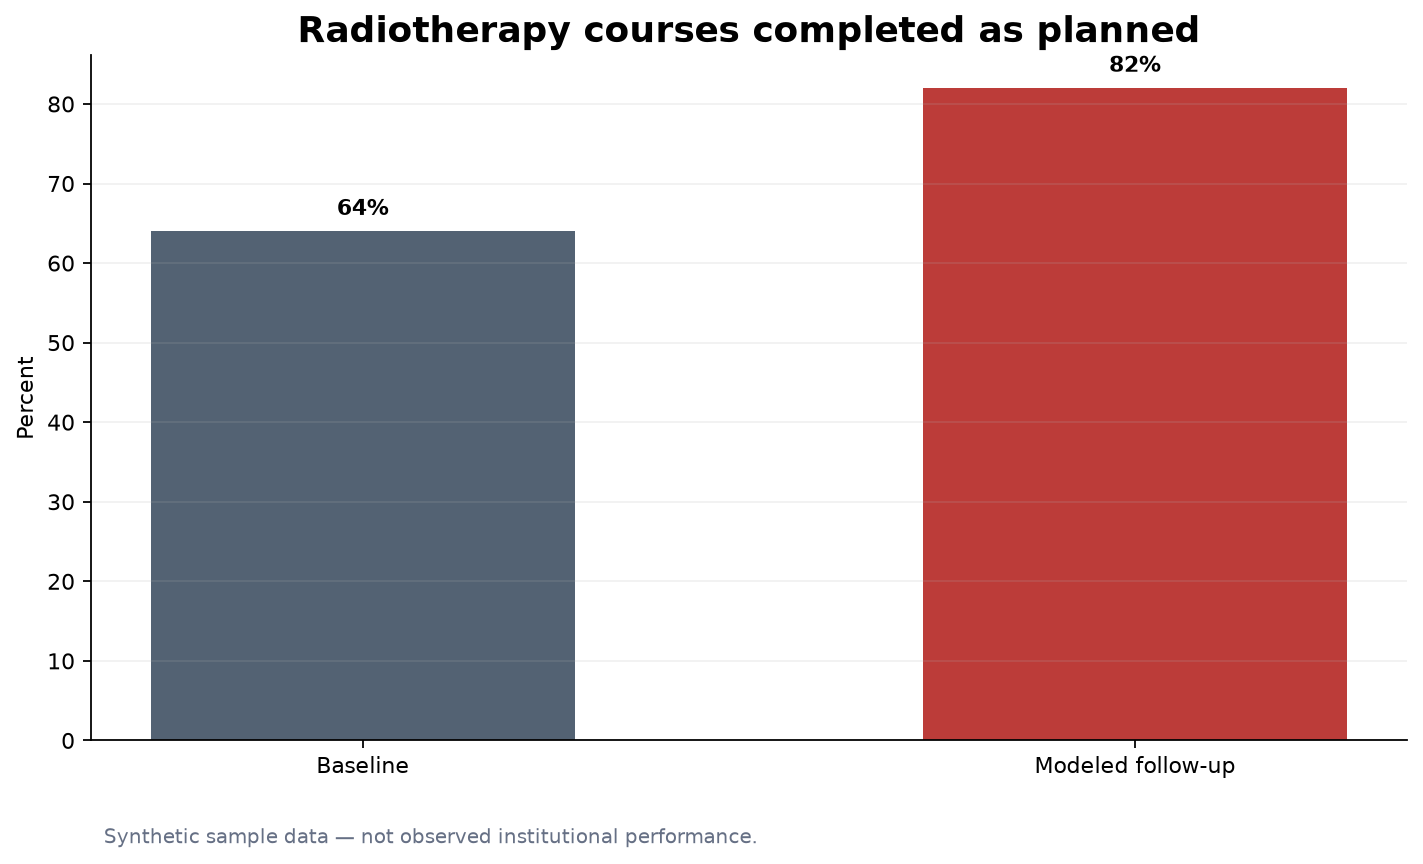 Figure 1. Synthetic primary result. Values are fictional and are shown only to test journal presentation.
Subgroup values ranged from 68 to 88 across <25 km, 25–74 km, 75–149 km, 150+ km. These synthetic contrasts allow the article page to demonstrate heterogeneity while remaining visually interpretable.
The sensitivity analysis preserved the same overall direction after removing records with incomplete timestamps. No subgroup reversal was introduced. The synthetic adjusted model produced moderate rather than dramatic effect estimates, which helps the sample paper resemble the cautious tone expected in peer-reviewed research.
At the start of the modeled period, radiotherapy courses completed as planned was 64%. The value increased to 82% in the final period, an absolute change of 18%. Because the observations are synthetic, the change is best understood as a display parameter chosen to produce visible but not implausibly perfect separation between periods.
The subgroup pattern was intentionally heterogeneous. The four displayed values were 88, 83, 76, 68 for <25 km, 25–74 km, 75–149 km, 150+ km respectively. This spread tests the journal's ability to present subgroup interpretation without allowing the main result to disappear under a large table or dashboard.
Missing-data sensitivity runs yielded slightly attenuated estimates but did not change the direction of the sample result. Records lacking complete modeled pathway timestamps were more common in the earlier period, which is a common operational pattern in real-world service data even though the exact frequencies here are fictional.
The synthetic collaboration variable did not alter the primary estimate; it exists to populate affiliation and Observatory relationships. Likewise, country and institution metadata are not explanatory covariates in the fictional analysis. Their role is to give the publication system realistic geographic and bibliographic structure.
Across the four sequential periods, the secondary indicator changed gradually rather than discontinuously. That trajectory is important for the visual test because it creates enough narrative depth to support discussion of implementation over time, while remaining simple enough for a reader to identify the principal message quickly.
Discussion
This synthetic study illustrates how radiotherapy access and travel burden could be reported in a mature AJCR issue. The principal visual result is intentionally straightforward, but the surrounding narrative emphasizes that pathway outcomes depend on implementation fidelity, documentation quality and the interaction between institutions and communities.
The modeled change in radiotherapy courses completed as planned should not be interpreted as evidence about University of Nairobi, University of Ibadan, or services in Kenya. The named institutions are used because the journal needs real geographic anchors to test affiliation rendering, institutional search and the Observatory network. All performance values are fictional.
A strength of the fixture is internal consistency. The abstract, Research Passport, body text, figure captions and PDF galley all draw from the same structured record. This makes it possible to test whether metadata diverges across surfaces as the site evolves.
The principal limitation is intentional: no inference about cancer outcomes is possible. The sample does not model the full clinical complexity of comorbidity, treatment selection, competing risks or health-system shocks. It also does not attempt to reproduce the patient population of the named institutions.
For future real submissions, the same presentation could support more detailed analytic reporting, including confidence intervals, model diagnostics, supplementary files and data availability statements. The current fixture keeps those elements legible without making the page feel like a dashboard.
The sample findings illustrate a general reporting challenge in radiotherapy access and travel burden: a headline percentage or score is rarely sufficient to explain why a pathway changes. In a real manuscript, investigators would need to relate outcome movement to intervention fidelity, differences in case mix, secular trends and the availability of downstream services. The synthetic discussion models that cautious interpretive stance without assigning any real-world performance to University of Nairobi.
The fixture also highlights why structured metadata should complement rather than replace conventional scholarship. Research Passport fields make design, setting, population, scale, funding, ethics and data availability easy to scan, but they cannot communicate causal assumptions, contextual uncertainty or the reasoning behind analytic choices. Those remain functions of the article narrative.
From a publication-design perspective, the figures were deliberately kept simple. A bar comparison tests figure width, caption hierarchy and mobile scaling, while the pathway diagram tests wide horizontal artwork. Together they expose layout problems that a text-only demonstration article would miss. Future real articles may of course contain survival curves, forest plots, microscopy, maps or multi-panel figures.
The synthetic cross-institution collaboration is similarly a systems test. By assigning one co-author from the next institution in the fixture ring, the Observatory can display countries, institutions and collaboration edges after publication. That network should be interpreted as fictional sample metadata, not evidence of an actual research relationship.
A real study would also require explicit consideration of selection bias, measurement error, confounding and generalizability. Those issues are acknowledged here at a conceptual level but are not estimable from generated records. The appropriate scientific conclusion is therefore not that the modeled intervention works, but that the AJCR platform can present a complex study transparently enough for readers to judge such questions when real evidence is submitted.
Finally, the sample provides a realistic stress test for editorial continuity. A reader may arrive through the issue table of contents, search, a thematic collection, the Observatory or a direct article URL. In each case the title, authorship, institutional affiliations, issue citation, PDF, structured metadata and figures should agree. That consistency is part of the publication product and can now be tested against a much denser first issue.
Conclusion
In this synthetic sample, radiotherapy courses completed as planned changed across the modeled implementation period while treatment interruption index moved in a consistent direction. These findings are fictional and exist only to exercise AJCR's first-issue publication design.
The article demonstrates how a complete AJCR paper can connect a concise Research Passport, long-form methods and discussion, figures, references, a PDF galley and institution-level metadata while keeping the scholarship visually primary.
The synthetic analysis of radiotherapy access and travel burden was designed to be internally coherent rather than scientifically inferential. Its main purpose is to approximate the density, rhythm and metadata burden of a full AJCR research article while preserving an unmistakable boundary between real institutional geography and fictional study content.
With the expanded narrative, two embedded figures, a complete PDF galley, references and structured metadata, this paper can now be used to evaluate the mature reading experience expected after the journal's first year of publication.
References
- Bray F, Laversanne M, Sung H, et al. Global cancer statistics 2022: GLOBOCAN estimates of incidence and mortality worldwide. CA Cancer J Clin. 2024;74:229-263.
- World Health Organization. Guide to cancer early diagnosis. Geneva: World Health Organization; 2017.
- World Health Organization. Global strategy to accelerate the elimination of cervical cancer as a public health problem. Geneva: World Health Organization; 2020.
- World Health Organization. Global Breast Cancer Initiative implementation framework. Geneva: World Health Organization; 2023.
- International Agency for Research on Cancer. Global Cancer Observatory: Cancer Today. Lyon: IARC.
- Sullivan R, Alatise OI, Anderson BO, et al. Global cancer surgery: delivering safe, affordable, and timely cancer surgery. Lancet Oncol. 2015;16:1193-1224.
- World Health Organization. Palliative care: key facts and health-system considerations. Geneva: World Health Organization.
- African Cancer Registry Network. Population-based cancer registration in sub-Saharan Africa: network resources and methods.